Saturday, January 9, 2021

Standardized generation of big spatial data in Spark

If you build a system or algorithm for spatial data processing, you might need to generate large scale spatial data for benchmarking. The generated data needs to have the following characteristics:
  1. Flexible: You should be able to easily control the characteristics of the data, e.g., size or skewness.
  2. Reproducible: It should be relatively easy to reproduce this dataset to allow others to repeat the experiments.
  3. Efficient: To be able to generate large-scale data without a problem.
All these characteristics are available in, spider, the award-winning open-source spatial data generator. Spider has currently three implementations, in Python, Ruby, and Scala on Spark. Spider was published in SpatialGems 2019 [1] and won the best paper award and was demonstrated in SIGSAPTIAL 2020 [2]. It is also publicly available on [https://spider.cs.ucr.edu]. The video below gives an overview of SpiderWeb. This article gives an overview on how the Scala implementation on Spark works.

Monday, July 29, 2019

UCR Star reveals Google Maps poor quality in Beijing, China (Or may be not!)

We used to hear stories about some mapping applications failing due to poor data quality. However, it makes a big difference when you find major failure of the most prevalent mapping application in the country with the biggest user base. The story is that while exploring some datasets in UCR Star, I found the following view of building in Beijing, China.

Sunday, July 14, 2019

A Star Is Born at UCR

UCR STAR


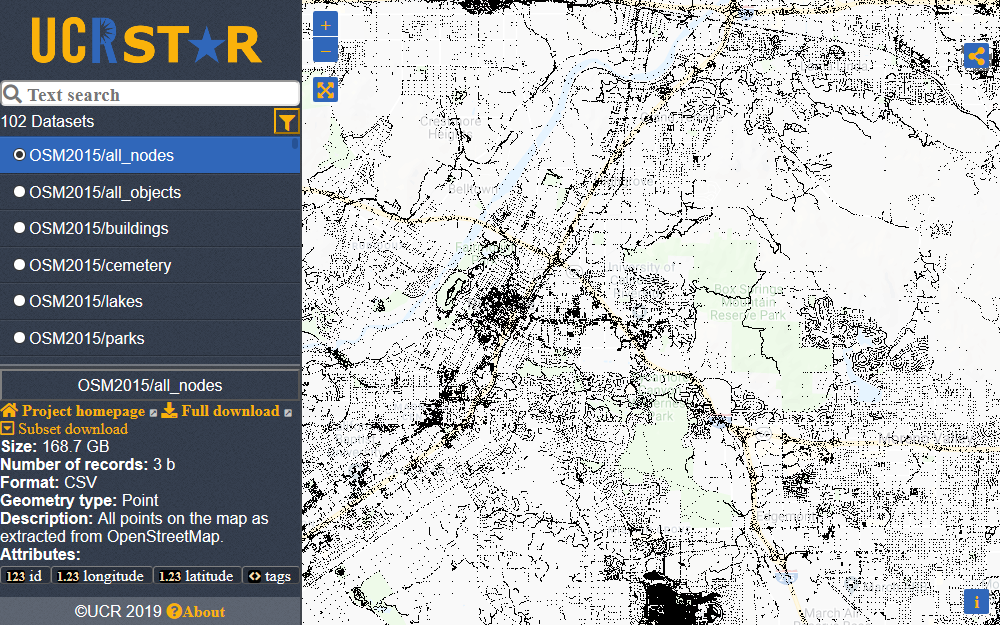
In the Big Data Lab at UCR, we are happy to announce the first release of UCR STAR, formally, the UCR Spatio-temporal Active Repository [https://star.cs.ucr.edu/]. STAR is made available as a service to the research community to provide easy access to existing big spatio-temporal datasets through an interactive exploratory interface. Researchers and developers can choose from the datasets and interactively explore them through a map-based interface. Users can also search and filter those datasets as if they are shopping for their research, except that everything is free. The website is best accessed through a desktop browser but a limited mobile-friendly interface is also provided. You can find more details on how to use the archive at [http://star.cs.ucr.edu/about.html].

Thursday, November 8, 2018

In the big data forest, we grow groves not trees

In this blog post, I describe a new indexing mechanism for big data. While the approach is general and can adapt many existing indexes to big data, this post particularly focuses on spatial index trees such as the R-tree as they tend to be more challenging. The key idea is that regular index structures are designed to write the index to disk pages in a regular file system and the indexes are expected to accommodate new records. In big data, indexes are written to the distributed file system which does not allow modifying the files.

Friday, October 20, 2017

Visualize SpatialHadoop indexes

I received several requests asking for help in building visualizations for SpatialHadoop indexes. In many of my papers, posters, and presentation, I display a visualization of spatial indexes like the one shown below.
[Click to enlarge] A Quad-tree-based index for a 400 GB dataset that represents the world road network extracted from OpenStreetMap.
There are actually several ways to visualize these indexes and the good news is that all of them are fairly simple. You can choose between them based on your needs.

Thursday, December 22, 2016

Visualize your ideas using Rasem

A major part of a researchers' work is to write papers and articles that describe their work and make posters and presentations to better communicate their ideas. We all believe that "A picture is worth a thousand words" and we are always looking for better ways to visualize our ideas. In this blog article, I present Rasem, a library that I built as I started my PhD and used it in many of my papers and presentation to build nice visualizations like the ones shown below.

Thursday, March 31, 2016

Around the world in one hour! (revisit)

In this blog post, we revisit an earlier blog post about extracting data from OpenStreetMap Planet.osm file. We still use the same extraction script in Pigeon but we make it modular and easier to reuse. We make use of the macro definitions in Pig to extract common code into a separate file. In the following part, we first describe the OSMX.pig file which contains the reusable macros. After that, we describe how to use it in your own Pig script.

Saturday, February 20, 2016

HadoopViz: Extensible Visualization of Big Spatial Data

With huge sizes of spatial data, a common functionality that users are looking for is to visualize this data to see how it looks like. This gives users the power of quickly exploring new datasets with huge sizes. For example, the video below summarizes 1 trillion points that represent the temperature of every 1 km2 on the earth surface on every day from 2009 to 2014 (total of six years).

Wednesday, December 2, 2015

Voronoi diagram and Dealunay triangulation construction of Big Spatial Data using SpatialHadoop

Voronoi Diagram and Delaunay Triangulation

A very popular computational geometry problem is the Voronoi Diagram (VD), and its dual Delaunay Triangulation (DT). In both cases, the input is a set of points (sites). In VD, the output is a tessellation of the space into convex polygons, as one per input site, such that each polygon covers all locations that are closest to the corresponding site than any other site. In DT, the output is a triangulation, where each triangle connects three sites, such that the circumcirlce of each triangle does not contain any other sites. These two constructs are dual in a sense that each edge in the DT connects two sites that share a common edge in VD.

Monday, November 30, 2015

Reducing the memory footprint of the spatial join operator in Hyracks

This is the fourth blog post in a series that describes how to build an efficient spatial join Hyracks operator in AsterixDB. You can refer to the previous posts below:
  1. An Introduction to Hyracks Operators in AsterixDB
  2. Your first Hyracks operator
  3. A Hyracks operator for plane-sweep join

Scope of this post

In the third post, I described how to implement an efficient plane-sweep join algorithm in a Hyracks operator. That implementation simply caches all data frame, or simply records, in memory before running the plane-sweep algorithm. As the input datasets go larger, this algorithm might require a huge memory footprint which is not desirable with the big data that is handled by AsterixDB. In this blog post, I will describe how to improve the previous operator to run with a limited memory capacity.

Tuesday, November 24, 2015

A Hyracks operator for plane-sweep join

This is the third blog post in a series of blog posts about creating an efficient Hyracks operator for spatial join. In the previous two posts, we gave an introduction to Hyracks operators and briefly described how to write a simple Hyracks operator. In this blog post, we describe how to make the previously created operator more efficient by using a plane-sweep spatial join algorithm instead of a naive nested loop algorithm.

Scope of this blog post

In this blog post, we will focus on improving the operator we created in the last blog post by replacing the nested-loop join subroutine with the more efficient plane-sweep join algorithm. In addition, we will do some minor code refactor to keep the code organized. For simplicity, we assume that the two inputs are already sorted on the x coordinate which can be done using one of the sort operators that ship with AsterixDB, e.g., ExternalSortOperatorDescriptor.

Monday, November 23, 2015

Your first Hyracks operator

In a previous blog post, I introduced Hyracks operators and briefly described how they work. In this blog post, I'll show how to create and use a very simple Hyracks operator that performs spatial join using a naive nested loop algorithm. Although there is already an existing nested loop join operator in AsterixDB, I provide a simpler, probably less efficient, implementation for the sake of demonstration. This blog post will focus on the steps needed to create a Hyracks operator while future blog posts will show how to improve this operator to be more efficient.

Friday, November 20, 2015

An Introduction to Hyracks Operators in AsterixDB

I had the opportunity to collaborate with the AsterixDB team led by Mike Carey and Chen Li in University of California, Irvine. The main objective of this collaboration is to introduce efficient ad-hoc spatial join query processing in AsterixDB. In this blog post, I will try to summarize my work for future developers and users of AsterixDB. I believe that this post could be very helpful as it is coming from an outsider. So, I will try to make it simple and will not assume and previous knowledge of AsterixDB. In fact, this is my first real interaction with AsterixDB system internals.

Sunday, November 1, 2015

Speeding up point-in-polygon query using Pigeon and SpatialHadoop

Point-in-polygon Query

A widely used function in GIS and spatial applications is the point-in-polygon query which finds whether a point is inside a polygon or not. Typically, this function is used as a spatial-join predicate to relate a large set of points to a smaller set of polygons, for example, associate a set of geo-tagged tweets to states in the whole world. If the polygons are relatively simple, e.g., a few tens of points per polygon, then we can use any simple spatial join algorithm such as plane-sweep or partition-based spatial merge join (PBSM). However, if the polygons are rather complex, e.g., tens of thousands of points per polygon, then a single point-in-polygon query becomes too expensive and regular solutions do not scale. In this blog post, I'll describe a simple technique that we applied using Pigeon and SpatialHadoop to speed up the point-in-polygon query in the case of very complex polygons.

Thursday, October 29, 2015

Quick tips for GPU programming

I was in the IEEE Big Data conference, and I attended a two-hour tutorial about GPU programming prepared by the folks in AMD. It was really nice and I would like to summarize the key points that I got from the tutorial for current and future GPU programmers.

Tuesday, June 30, 2015

Setting up Pigeon on Pig and Hadoop

From Pig to Pigeon

Pigeon

Pig is a framework that allows developers to express their MapReduce programs in a nice and easy-to-use high level language, termed Pig Latin. Pigeon builds on top of that by providing a set of user-defined functions (UDFs) that can manipulate spatial data. In this blog post, I'll describe in a easy steps how to install and run Pigeon on an existing Hadoop cluster running Pig.

Friday, March 27, 2015

Around the world in one hour!

Abstract

This blog post shows you how you can process the whole Planet file produced by OpenStreetMap in only one hour. We use SpatialHadoop, an extension to Hadoop that supports spatial data, along with its high level language, Pigeon, to distribute the work over 50 machines and get it done within one hour instead of a week. The program is only tens of lines of code and can be easily customized to produce different output datasets or do further processing to output a more suitable output.

Planet file

OpenStreetMap is a great source of maps and geographic data. It allows volunteers to contribute to maps all over the world and make all this data publicly available for use. This data is officially provided in one big XML file called the Planet.osm file. It contains all information from all over the world in one common XML schema. Since this XML file is not in a standard format that GIS software can deal with, you need to convert this file into a more standardized format. Osm2pgsql is one alternative that loads the whole file into a standard DBMS schema where you can further use PostGIS to process it. According to the benchmark, it takes around two days just to load the file into the database. Some optimizations along with a very powerful machine, can get this down to around 7 hours. I have been taking to people who tried it themselves and it takes up to seven days on a commodity machine. With the technique shown in this blog post, we area able to take this down to less than one hour. In the rest of this blog post, we will show how you can do it yourself.

Pigeon

Pigeon is an open source project that adds OGC-standard spatial functions to Pig Latin. This makes it capable of processing very large files efficiently and easily on a cluster of machines running Hadoop. We use it to parse the Planet file and produce the objects of interest out of it.

Setup

To run this script, you need the following.
  • A running Hadoop cluster operating on HDFS. Check the setup guide of Hadoop 2.6.0
  • Pig installed and configured to run with Hadoop. Check the setup guide of Pig 0.14.0
  • The script requires the jar of Pigeon to be present in the same folder as the script. Download the jar of Pigeon 0.2.0.
  • The JAR file of SpatialHadoop which contains some UDFs used to parse the Planet.xml file. This JAR file can be found in the binary package of SpatialHadoop 2.3.
  • You also need the JAR file of JTS 1.8 and ESRI-Geometry-API which also ship with SpatialHadoop and can be found in the binary package.
  • You need the JAR of piggybank which contains the XML parser. You will find this JAR file as part of your Pig installation.
  • You need to 'pigeon_import.pig' file which is downloaded here.
  • Finally, you need the extraction script which is available as part of the source code of SpatialHadoop on github.

How to Run

To run the extraction script, you need to place the osmx.pig script along with all required JAR files in the same folder. Then, you need to execute the script using Pig. For example, if your input file is called '/planet.osm.bz2' stored at the root of your HDFS, and you want to store the output to the path '/planet-datasets', you will execute the following command
pig -param input=/planet.osm.bz2 -param output=/planet-datasets osmx.pig
Pig will execute a series of MapReduce jobs depending on the type of data generated. You can track its progress from the job tracker or the resource manager. The next part of this blog post will show how the script runs and how it can be customized to generate data that better matches your need.
Notice that the code contains the keyword 'PARALLEL' in several places to adjust the parallelism according to number of reducers in the cluster. You can adjust this number according to your cluster size to tune up the performance.

Extraction Script

The script runs in three phases, node extraction, way extraction, and relation extraction.

Extracting nodes

The first phase extracts only the data in the nodes section. Each node contains an ID, latitude, longitude, and a set of tags represented as key-value list. The code of this part is shown below.
xml_nodes = LOAD '$input' USING XMLLoader('node') AS (node:chararray);
parsed_nodes = FOREACH xml_nodes GENERATE OSMNode(node) AS node;
If you're interested in extracting data in a specific region, this would be the best place to filter the data according to its location. For example, if you want to extract the data around the state of Minnesota, you can add the following line
parsed_nodes = FILTER parsed_nodes BY ST_Contains(ST_MakeBox(-97.2,43.5,-89.5,49.4), ST_MakePoint(node.lon, node.lat));

Extracting ways

In the second phase, ways are extracted from the second section in the Planet file. These ways are joined with nodes to produce shapes that connect the nodes together. This can either produce full objects, if they are very small, or partial objects, if they are too large for a way. The code for this part is shown below
xml_ways = LOAD '$input' USING XMLLoader('way') AS (way:chararray);
parsed_ways = FOREACH xml_ways GENERATE OSMWay(way) AS way;
flattened_ways = FOREACH parsed_ways
  GENERATE way.id AS way_id, FLATTEN(way.nodes), way.tags AS tags;
joined_ways = JOIN node_locations BY id, flattened_ways BY node_id PARALLEL 70;
ways_with_nodes = GROUP joined_ways BY way_id PARALLEL 70;
ways_with_shapes = FOREACH ways_with_nodes {
  ordered = ORDER joined_ways BY pos;
  tags = FOREACH joined_ways GENERATE tags;
  GENERATE group AS way_id, ST_MakeLinePolygon(ordered.node_id, ordered.location) AS geom,
    FLATTEN(TOP(1, 0, tags)) AS tags;
};
The first two lines read and parse elements of the ways section. Each way is represented by an ID, tags, and a list of node IDs. Connecting the nodes with these IDs produce the shape of the way. Lines 3 and 4 flatten the ways so that each record contains one node ID and then join this with nodes to add the location of each node (latitude, longitude). After that, we perform a GROUP BY operation to group these objects back by way ID after they were annotated with locations. The method MakeLinePolygon creates a geometric shape out of a list of points. If the ID of the first and last points are the same, a polygon is created, otherwise, a linestring is created. If you are only interested in objects formed by ways, you can just write this result to the output file.

If you're interested in line segments instead of full shapes, you can use the following commands which generates the result as a collection of line segments, each connecting two points together.
roads_with_nodes = GROUP joined_ways BY way_id PARALLEL 70;
raod_segments = FOREACH roads_with_nodes {
  ordered = ORDER road_network BY pos;
  tags = FOREACH road_network GENERATE tags;
  GENERATE group AS way_id, ST_MakeSegments(ordered.node_id, ordered.location) AS geom,
    FLATTEN(TOP(1, 0, tags)) AS tags;
};
raod_segments = FOREACH raod_segments GENERATE way_id, FLATTEN(geom), tags;
It starts from the joined_ways and instead of calling the MakeLinePolygon function, it calls the MakeSegments function which generates a list of road segments for each two consecutive points. This can be used, for example, to generate the road network graph as a set of edges.

Extracting relations

Phase 3 extracts relations in a similar way of extracting ways. It reads and parses relations where each one is represented as a list of way IDs. It flattens it to produce one way ID per line, and then joins it with ways. Finally, the result is grouped again by relation ID and the function Connect is called. The Connect functions connects multiple linestrings together to produce a longer linestring or a polygon, if they form a closed ring. The code is shown below.
xml_relations = LOAD '$input' USING XMLLoader('relation') AS (relation:chararray);
parsed_relations = FOREACH xml_relations GENERATE OSMRelation(relation) AS relation;
flattened_relations = FOREACH filtered_relations
  GENERATE relation.id AS relation_id, FLATTEN(relation.members), relation.tags AS tags;
relations_join_ways = JOIN flattened_relations BY member_id RIGHT OUTER, ways_with_shapes BY way_id PARALLEL 70;
relations_with_shapes = FOREACH relations_by_role {
  tags = FOREACH relations_with_ways GENERATE tags;
  GENERATE group.relation_id AS relation_id, group.member_role AS way_role,
    ST_Connect(relations_with_ways.first_node_id, relations_with_ways.last_node_id, relations_with_ways.way_shape) AS shape,
    FLATTEN(TOP(1, 0, tags)) AS tags;
};

Results

We tried this script on a cluster of around 50 nodes running Hadoop 0.20.205.0 and Pig 0.12.1. It took around one hour to run all of the three phases and generate all relations from the file 'planet-150112.osm.bz2' with total size of 40GB.

Further Reads

[1] http://tareeg.net
[2]  Louai Alarabi, Ahmed Eldawy, Rami Alghamdi, Mohamed F. Mokbel, "TAREEG: A MapReduce-Based Web System for Extracting Spatial Data from OpenStreetMap", In Proceedings of the ACM SIGSPATIAL International Conference on Advances in Geographic Information Systems, (SIGSPATIAL GIS 2014), Dallas, TX, November 2014
[3] Louai Alarabi, Ahmed Eldawy, Rami Alghamdi and Mohamed F. Mokbel, "TAREEG: A MapReduce-Based Web Service for Extracting Spatial Data from OpenStreetMap", In Proceedings of ACM SIGMOD Conference on Management of Data, (ACM SIGMOD 2014), Salt Lake City, UT, June, 2014

Friday, January 30, 2015

Installing SpatialHadoop on an existing Hadoop cluster

I occasionally get a question about how to install SpatialHadoop on an existing cluster that runs Hadoop. So, decided to write this blog post to describe the different ways to setup SpatialHadoop on an existing cluster.
In this blog post, I'll describe two techniques to install SpatialHadoop on an existing cluster. The first techniques requires an administrator access to Hadoop, not necessarily to the while system. The second technique is less efficient but can work even if you cannot restart the cluster or manage it.

The first techniques

In this technique, all you need to do is extract the binaries of SpatialHadoop on every node in your cluster. This technique is only tested with Hadoop 1.x but it can also with with Hadoop 2.x, at least in concept. The binary archive of SpatialHadoop matches this of an Apache Hadoop 1.x installation. Basically, it installs the required libraries in the lib folder. Once the required libraries are in place on all machines, you need to restart the cluster to ensure that the libraries are loaded. After that, your cluster is ready to use.

Hadoop 2.x

Although not officially supported, you can use the same technique to install SpatialHadoop on Apache Hadoop 2.x. To do that, you first need to grab the source code of SpatialHadoop and build the binary package, then you can install it in your Hadoop distribution.
To grab the latest source code
git clone https://github.com/aseldawy/spatialhadoop2.git
ant dist2
The created package can be installed in a similar way on an Apache Hadoop 2.x

The second technique

In this technique, we assume that you don't have administrator access to the cluster so you can't install the libraries in Hadoop nodes or restart the cluster. Therefore, we compile SpatialHadoop libraries along with all required libraries into one jar which you can run using 'hadoop jar' command.
To create that jar, you need to grab the latest source code from github and then create the jar using the ant command.
git clone https://github.com/aseldawy/spatialhadoop2.git
ant emr-jar1
Once you create the jar file, you can run it using the command hadoop jar.
Similarly, if you're going to run the created jar on Hadoop 2.x, you should use the ant target emr-jar2 instead of emr-jar1

Thursday, October 31, 2013

The day I changed my default search engine from Google to Bing

We use search engines more than we use anything else on the web. Your selection of a search engine greatly affects you. I'm a Google fan and use most of their services including their very first service, search engine. This was until I decided to move to Bing.
Before you start defending the quality of your favorite search engine, I need to tell you it's not aboassociated with a t quality, it's about privacy. I recently moved to a new working environment where all machines are behind a NAT box. Without going into technical details, this means that all machines appear to the outside world as one machine. I didn't notice any difference at the beginning, but occasionally I see this message when I search for something.
This implies that Google received too many search requests from the same machine (i.e., NAT box) and they identify this as automated queries. After doing some research, I figured out that this only happens when I use the incognito mode in chrome. The reason, I guess, is that I link my Google account to Chrome. This allows Google to identify the search requests associated with a Google account and bypass the security check. I don't like that. It means that Google servers can really handle all the requests. They either want to break in my privacy or are too lazy to implement a better automatic-queries-detection technique. May be I'm wrong, but the message I got from this is 'Unless you give up some of your privacy, we'll not serve you!'
I changed the default search engine to Bing and this resolved the issue. The next step is to stop using Chrome. I'm a little bit skeptic about privacy and I'm worried about the moment they start tracking my website history.
Now I hear some questions from you. I'll try to answer them briefly here.
Q: Why Bing?
A: Don't know, don't care. I still think that Google is better in terms of quality. All other search engines are similar to me. May be because I have some friends working in Microsoft and talking about Bing. May be because I had an internship in Microsoft last year.
Q: Why search engine? Why don't you stop using all Google services and delete your account?
A: Yeah! Why not? And stop using the Internet too :) I hope I can do so but Google services are really good and I still like them. I think however that the search engine is more important. I use it more that any other service. I use it in my research. I use it to find a gift for my mom. I use it to look up the possible diseases for my symptoms. For other services, I carefully choose what to put there. It's a tradeoff between privacy and quality. I'm willing to give up some privacy to get better quality. But I'm not going to give up a lot of privacy to get only a bit better quality. If I find good alternatives to other Google services, I may go for them.

Sunday, September 2, 2012

Creating a tiled floor pattern

In the house I was staying in while in Bellevue/WA, there was a floor pattern that looks like the image below. It's easy to figure out how to create such a pattern using a combination of small and big tiles. I tried to create that pattern in a graphics program just for fun.
I used Inkscape to create the image below but it turned out to be a tedious job. It's really boring to clone figures and align them in that shape. The right way to do it is to use patterns. It's not trivial, however, to figure out the pattern that repeats. Note that a repeating pattern should be a rectangular area. Two squares of different sizes do not form a valid pattern to use.
The easy way is to find a large rectangular area that repeats. This repeating pattern can be easily found and highlighted as shown below. However, it doesn't really seem nice to have such a complicated pattern. Moreover, according to the sizes of the two squares, the repeating pattern could become arbitrarily and extremely large. An alternative way to make it is described in this post.
The trick to find the repeating pattern is to tilt your head a little bit. The pattern really repeats along a line with a small angle. If we align small squares on a horizontal line, the pattern would contain one small square. All we need to do is to tilt the whole view with the correct angle. In the shown pattern, square sizes are 10 and 40. Therefore, the right angle is atan(10/40) ≅ 14°. Rotating the view brings the following image.
Rotate all drawn figures

How it looks after rotation

Once the view is tilted as shown above, any square of the correct size would form a valid repeating pattern. The correct size is a square enclosing the complete repeating pattern. Simply, the borders of this repeated pattern would span from any point, to its counterpart in the adjacent tile. Let's take the corners of the small black square as our pivot point. The repeating pattern will be similar to the one below.
A sample part of the image that can be used as a pattern. Note: I changed the black squares into holes just for presentation and clearance.
You can easily use triangle geometry to calculate the size of the repeating tile (it's a square by the way). From the figure below, the length of the edge of this square is sqrt(102+402).
How to calculate the size of the pattern square
Once we find the size of the repeating pattern, cropping any square of this size from the figure we created forms a repeating pattern. Note that, by definition, the pattern repeats and logically it has no begin or end. We create a (pattern) square of the calculated size above. Then, we union all the repeating (rotated) figure we created earlier. Finally we place the (pattern) square any place on the figure and find the intersection of both. All these steps are shown in figures below.
Create a square to be used as the pattern

Union the figure we created earlier. Note that we need this figure to contain only one black square.

Intersection the pattern square with the figure we drew
This leaves us with the pattern shown in the figure below. Using this a tiled pattern would produce the same (rotated) pattern we drew earlier. You can then rotate the object that contains the pattern to produce the original figure we wanted to draw.

The resulting pattern
The final view will look similar to the one below.
Final view drawn using the pattern
Note that the final view has some glitches. The reason is that I used Inkscape which limits all numbers I use (for rotation degrees, lengths ... etc.) to three digits after the decimal point. This means that the accuracy is limited to this precision and I couldn't create a very accurate figure. I guess that another program may overcome this problem but the main idea is still valid.